Maximum drawdown is rarely the first metric investors talk about.
But it’s often the one that decides whether a strategy survives long enough to matter.
Returns can look impressive on paper. A smooth upward line, a strong average, maybe even low volatility. And then a single deep drawdown arrives and quietly tests everything—capital, discipline, and expectations. Professionals understand this dynamic well. That’s why maximum drawdown is treated less like a statistic and more like a stress test of real-world risk.
If you’re searching for maximum drawdown, you’re probably trying to look past surface-level performance. Definitions are easy to find. Interpretation is not. Many explanations stop at the formula, leaving out the nuance that actually determines whether the metric is useful—or misleading. That’s where confusion creeps in, especially when drawdown is compared to volatility or risk-adjusted returns without proper context.
This guide is built to close that gap.
We’ll start with a clear definition and calculation, then move into how professionals interpret drawdown in practice. Along the way, we’ll examine why recovery time matters, where drawdown can fail if used alone, and how it fits into a broader risk management framework. One mathematical reality frames the entire discussion: a 50% loss requires a 100% gain just to break even. That asymmetry shapes every serious approach to risk.
By the end, you won’t just know what maximum drawdown is. You’ll understand how to use it responsibly—and why informed investors treat it as a guide, not a guarantee.
What Is Maximum Drawdown?
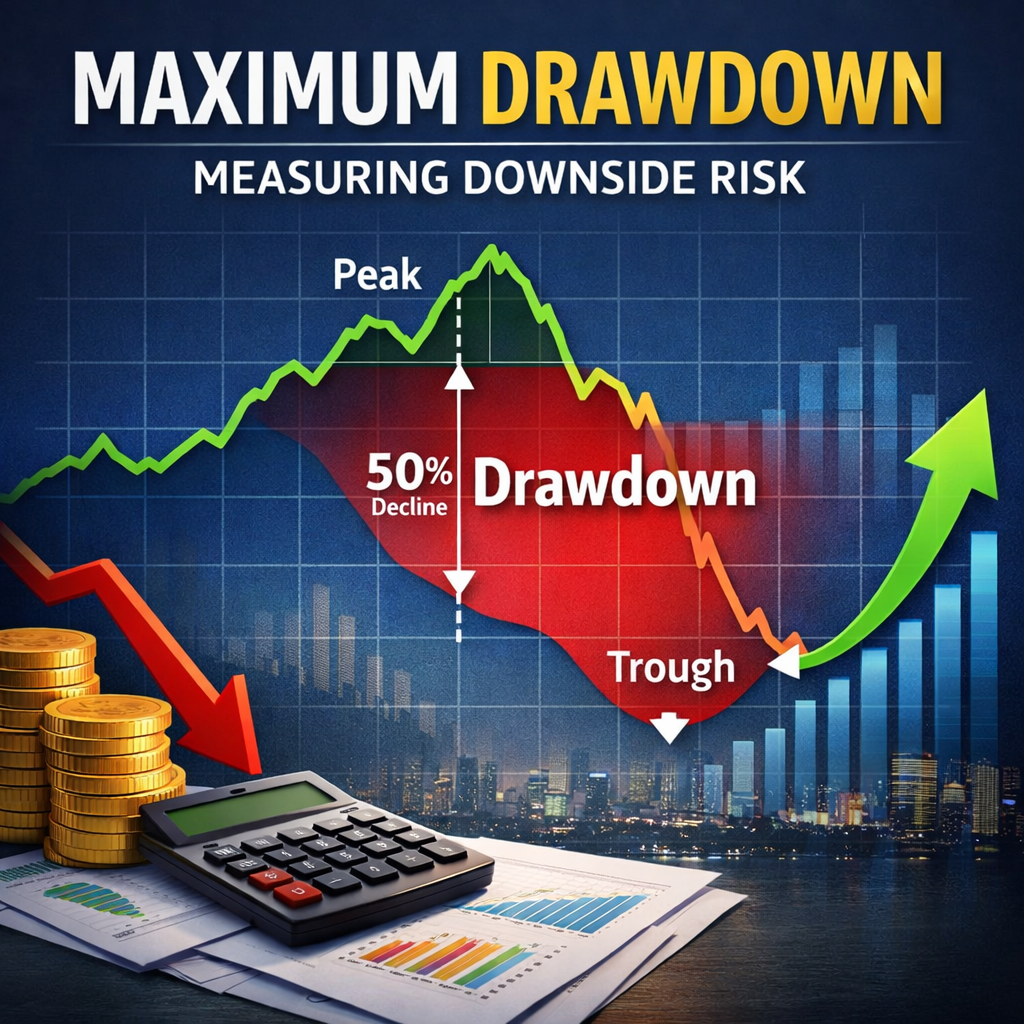
Maximum drawdown measures the largest percentage decline in value from a portfolio’s peak to its lowest point over a specific time period.
Put simply, it answers a difficult but essential question: What was the worst loss an investor would have experienced before the portfolio recovered?
More formally, maximum drawdown represents the single greatest peak-to-trough decline observed in historical performance data. It is always expressed as a percentage and always reflects a loss. If a portfolio rises, falls sharply, and later recovers, the drawdown is measured at the deepest point of that decline—not at the end of the period. (TradeVae Academy)
That distinction matters.
Unlike volatility or standard deviation, maximum drawdown focuses exclusively on downside risk. It ignores how often prices fluctuate and concentrates instead on how severe the worst loss was. This is why it is commonly used in portfolio analysis, fund evaluation, and institutional risk frameworks.
A frequent misconception is that drawdown describes a temporary dip. In reality, it captures the most extreme loss of capital observed, regardless of how quickly or slowly recovery occurred. Before moving on to calculations or comparisons, it’s important to internalize that framing.
How Is It Calculated
The math behind maximum drawdown is straightforward. Getting it right is not always as simple.
At its core, maximum drawdown compares each portfolio value to its highest previous value and measures the percentage decline from that peak to the subsequent trough. The standard formula looks like this:
Maximum Drawdown = (Trough Value − Peak Value) ÷ Peak Value
For example, if a portfolio rises to $100,000 and later falls to $70,000 before recovering, the maximum drawdown is −30%. Even if the portfolio eventually exceeds $100,000, that drawdown remains part of its historical record for the period analyzed. (LBank Academy)
Context matters here. A lot.
The timeframe chosen, the frequency of the data, and the consistency of the measurement window all influence the result. Daily data often reveals deeper drawdowns than monthly data, simply because short-term losses are smoothed out at lower frequencies. Short observation windows can understate long-term risk altogether.
Professionals are careful for this reason. Misidentifying peaks or truncating the dataset can materially distort drawdown figures. That’s also why maximum drawdown is typically evaluated alongside other risk measures rather than viewed in isolation.
Why Maximum Drawdown Matters in Risk Management
Maximum drawdown matters because losses compound differently than gains.
A 20% loss requires a 25% gain to recover.
A 50% drawdown requires a 100% gain just to break even.
This asymmetry isn’t theoretical. It directly affects how long capital remains impaired and how much pressure is placed on future returns. From a risk management perspective, drawdown reflects capital stress, not just price movement.
There’s also a behavioral dimension. Large drawdowns increase the likelihood of poor decisions—panic selling, strategy abandonment, or mistimed reallocations. Even strategies with strong long-term returns can fail investors if interim losses exceed their tolerance or time horizon.
That’s why professionals rarely ask whether a return is “good” without also asking how it was achieved. Maximum drawdown provides context that averages and point estimates cannot. It shows the path taken, not just the destination.
At the same time, drawdown is not predictive. It is backward-looking and silent about future risk. Used correctly, it helps investors understand historical exposure. Used carelessly, it can create false confidence. Both sides of that reality matter.
Interpreting Maximum Drawdown Correctly (Where Most Analyses Break Down)
Maximum drawdown is often treated as a standalone score: lower is better, higher is worse. That assumption is convenient—and incomplete.
The first nuance professionals consider is path dependency. Maximum drawdown depends on the sequence of returns, not just their magnitude. Two portfolios can produce identical long-term returns and similar volatility yet exhibit very different drawdowns depending on when losses occurred. Early losses compound differently than late ones, which is why drawdown analysis is inherently tied to time-series behavior rather than summary statistics. (Diversification.com)
Then there’s drawdown duration. Size alone doesn’t tell the full story. How long capital remains below its prior peak can be just as important, especially for investors with liquidity needs or finite horizons. A moderate drawdown that persists for years may be more damaging in practice than a sharper loss that recovers quickly. (FinancialAnalystGuide.com)
This is where misinterpretation often begins. A low historical drawdown does not mean a strategy is “safe.” It may simply reflect a favorable market environment. Professionals treat drawdown as contextual evidence, not a promise.
Maximum Drawdown vs Volatility: Why They Often Disagree
Volatility is commonly used as a proxy for risk. Maximum drawdown often tells a different story.
The reason is simple. Volatility measures how widely returns fluctuate around an average. It treats upside and downside movement symmetrically. Maximum drawdown does the opposite. It ignores most movements and focuses exclusively on the single worst loss.
As a result, strategies with smooth but persistent declines can exhibit low volatility and severe drawdowns at the same time. That mismatch explains why some low-volatility strategies appear stable until a structural break occurs. Drawdown exposes that vulnerability because it captures tail outcomes, not typical behavior.
From a professional perspective, neither metric is sufficient on its own. Volatility describes day-to-day variability. Maximum drawdown highlights capital risk under adverse conditions. Used together, they offer a far clearer picture.
The mistake isn’t using volatility. It’s assuming volatility tells the whole story.
How Professionals Use Maximum Drawdown in Portfolio Construction
In professional risk management, maximum drawdown is rarely optimized directly. Instead, it’s used as a constraint.
The more useful question isn’t “Which strategy has the lowest drawdown?” It’s “What level of drawdown is tolerable given the investor’s objectives, time horizon, and behavioral limits?” That threshold then informs asset allocation, leverage decisions, and diversification choices.
This framing shifts drawdown from a ranking metric to a governance tool.
Advanced practitioners also stress-test drawdown assumptions across different market regimes. They examine how drawdown behaved during periods of stress, not just in aggregate historical data. Where evidence is limited, they treat drawdown estimates conservatively and pair them with scenario analysis rather than point forecasts.
Used this way, maximum drawdown becomes part of an ongoing risk dialogue—informative, imperfect, and indispensable when interpreted with care.
A More Useful Way to Think About Drawdown: Capacity, Duration, and Depth
Most discussions reduce drawdown to a single number. Professionals don’t.
A more practical framework separates drawdown into three dimensions:
- Depth: how large the loss is.
- Duration: how long capital remains below its previous peak.
- Capacity: the investor’s ability—financial and behavioral—to remain invested during that period.
Two portfolios with identical maximum drawdowns can feel completely different in practice. A sharp 25% decline that recovers quickly places very different demands on capital than a slower, grinding loss that lasts years.
Capacity is the most neglected element. It reflects liquidity needs, governance constraints, and psychological tolerance. Drawdowns only become fatal when they exceed an investor’s capacity to endure them. That’s why institutional frameworks focus on drawdown limits rather than drawdown minimization.
Seen this way, maximum drawdown becomes diagnostic, not judgmental. It signals where stress appears—and whether it’s manageable.
Why “Lower Drawdown Is Always Better” Can Miss the Point
It’s tempting to assume that reducing drawdown should always be the goal. Intuitive, yes. Always correct? No.
Strategies engineered to suppress drawdown often do so by sacrificing exposure to growth assets, embedding hidden tail risks, or relying on historical relationships that may not persist. In calm environments, they can look robust. Under regime change, they may fail abruptly.
There’s also a behavioral paradox. Investors drawn to ultra-low drawdown strategies may underestimate the risk of rare but severe losses precisely because interim volatility appears muted. In contrast, strategies with visible—but bounded—drawdowns often foster more realistic expectations and better long-term adherence.
The more useful question is not “How low is the drawdown?” but “Is this drawdown consistent with the role this strategy plays in the portfolio?” That shift—from metric optimization to system design—is where drawdown analysis becomes genuinely useful.
Conclusion: Using Maximum Drawdown as a Lens, Not a Label
Maximum drawdown is most valuable when it’s treated as a lens on risk, not a label of quality. On its own, it records a single historical fact: the worst peak-to-trough loss observed over a given period. In context, it becomes something more informative.
Throughout this guide, we’ve connected drawdown to recovery dynamics, behavioral pressure, volatility, and portfolio role. We’ve seen why drawdown differs fundamentally from other risk metrics, why duration matters alongside depth, and why professional frameworks treat drawdown as a constraint rather than a target.
The practical takeaway is straightforward. Don’t chase the lowest drawdown. Define what level of drawdown is tolerable given your objectives, liquidity needs, and time horizon. Evaluate strategies using consistent historical data, pair drawdown with complementary measures like volatility and risk-adjusted returns, and remain cautious about conclusions drawn from short or unusually favorable periods.
It’s also worth repeating the limits. Maximum drawdown is backward-looking, assumption-dependent, and incapable of predicting future outcomes. Used thoughtfully, however, it remains one of the clearest ways to understand how risk actually shows up.
The most important shift is conceptual. Drawdown isn’t something to avoid at all costs. It’s something to understand, prepare for, and align with purpose. When treated that way, it becomes less intimidating—and far more useful.
Learn more about our risk control management or how to protect stock gains.